V-Ray Illumination Relevance Test
This page offers a comparison test case of V-Ray results to officially conducted research on illumination validity of other renderers.
Page Contents
Overview
This test case replicates the daylight simulation setup from a paper called Experimental Validation of Autodesk® 3ds Max® Design 2009 and Daysim 3.0 (Reinhart, 2009) using V-Ray 3.60.03 for Autodesk 3ds Max 2017.
The referred experiment conducted by Reinhart "compares the daylight simulation results with Autodesk® 3ds Max® Design 2009 software (3ds Max Design)... to real indoor illuminance measurements in a sidelit space"1. The goal we set with this test case is to compare how the advanced technology of V-Ray version 3.60.03 performs with the input of Autodesk's initial research. Further, we explore how to provide faster and accurate renderer with better render image quality using Reinhart's results as a benchmark.
Prerequisites
As our starting point is the referenced paper, we should firstly outline several important things in relation to it.
The software used is Autodesk's 3ds Max Design 2009. V-Ray version 3.xx does not support 3ds Max versions prior to version 2013. That necessitated the use of an updated 3ds Max version for the test. We used the 3ds Max version 2017, as Mental Ray is still integrated and shipped within the official version. That allows for later comparison, if needed. In regards to the provided features, 3ds Max fully covers 3ds Max Design ones.
Preparation of the 3D model and scene
The test scene in this comparison case was recreated as close as possible to the referenced paper.
V-Ray Sun and VRaySky were used, as well as V-Ray materials assigned with the same values as in the paper. A couple of things were intentionally altered - the unsupported sky model and the refraction value of the glass panel.
The window panels in our scene were created with separate objects for each glass pane. Hence, applying the value registered for an Arch and Design material of a double glazing window (meant for simulating the two panels out of a single object) to these two separate objects with a V-Ray material, would have been incorrect. Instead, the measured transmissivity of 72.0% from the NRC Daylighting Laboratory research was applied.
In order to determine the correct refraction value, the window was placed in another empty scene with white background and refraction environment, and black GI environment and reflection environment. The target was to measure 72% gray as rendered result, which represents the transmission from refraction in an exclusive manner. A value of 72% gray is represented as 183.3 of [0-255] RGB value range or 0.72 of its float representation. The refraction color value of 237.2 produced the closest result (183 8-bit color value and 0.719 float color value to be exact).
The Perez Sky model used for the Daysim Simulations was replaced with a Hosek et al. implementation. According to An Analytic Model for Full Spectral Sky-Dome Radiance (Hosek and Wilke, 2012) the Hosek et al. model is more advanced and accurate than the Perez Sky model, thus our use of it.
Since the original 3d model was not provided, it was rebuilt using all available data for the research. Missing measurements were adjusted to match the camera perspective as close as possible.

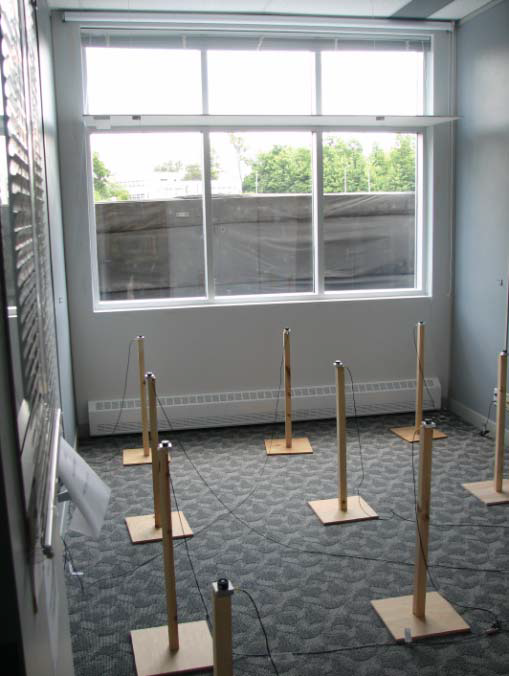
Original Image found in Experimental Validation of Autodesk® 3ds Max® Design 2009 and Daysim 3.0 (Reinhart, 2009)

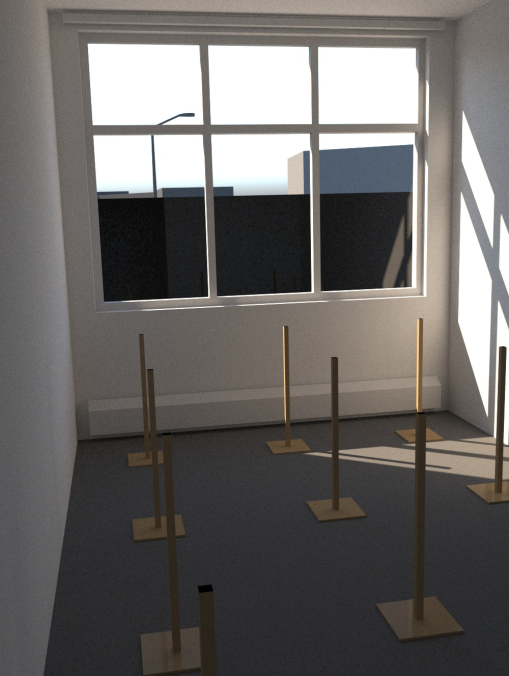
Scene recreation with V-Ray 3.60.03 in 3Ds Max 2017
During the test we found that the surrounding outside environment significantly affects the illumination result. The NRC Daylighting Laboratory has distinctive facade which makes it easily recognizable on Google Maps. It has several tall trees on the east and a tall building on the south (45.450448, -75.621741). Simplified models were added to match their location to Google maps's, and their size was matched from available footage. Additionally, there is a small canopy over the entrance next to the room where light measurements were performed. It was modeled too for more accurate results. Its measurements were derived from the size of its shadow on the date the Google Earth photo was shot 2 .
Measuring the Light Values
The test scene holds a full 24h animation of the Sunlight. Its position was determined with the Daylight 3ds Max tool and set for the same date as the Sunny day research - 13th of May 2008. Each frame in the test scene corresponds to 5 minutes offset. A custom script was executed to automate light values calculation at each frame of interest, where illumination curve was provided in the paper. The calculation itself was handled by VRayLightMeter. The V-Ray Light Meter is a utility that provides exact light measurement values at distinct points in the scene where its gizmo is located.
Results
The VRayLightMeter provides several points of measurement at once. Once calculated, the result for the current frame is automatically saved to a .csv file with all of the resulted illumination values. Only the result from the VRayLightMeter's central point, numbered 4th in the .csv files, under Total lighting, was used in our test. It is the most accurate having in mind the small surface on the DS sensors.
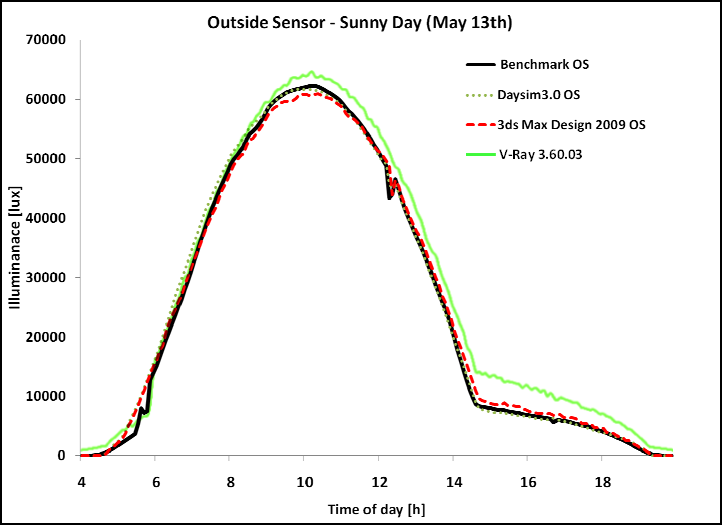
Outside sensor on Sunny Day (May 13th) graph from the original research presents the data for the hours from 4 AM to 8 PM. VRayLightMeter was calculated in frames from #48 to #240 and saved to .csv files for each frame. The VRayLightMeter result (in green) is overlayed on top of the original graph in the picture below.

This graph is available in the provided .ods file.
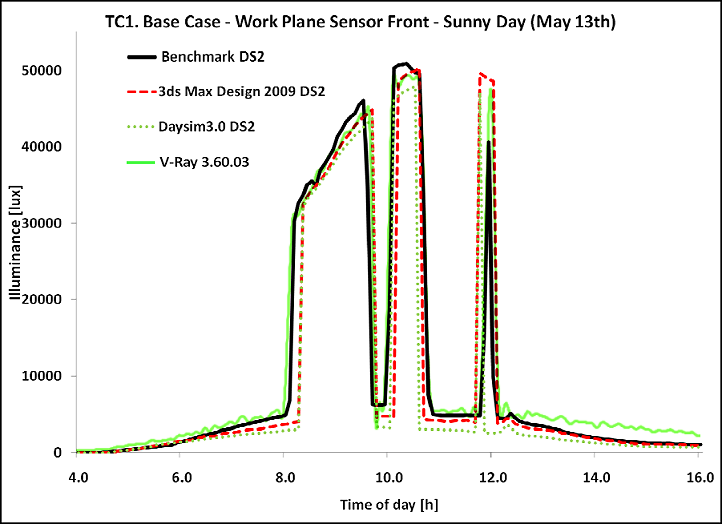
In a similar manner, the VRayLightMeter result for the indoors DS2 sensor was calculated and saved in .csv files for each frame between #48 and #192 (total of 145 files) for the same Sunny day (May 13th).
The TC1 Base case measurement from DS2 sensor is overlayed with the results from VRayLightMeter (in green) in the graph below.

This graph is available in the provided .ods file.
Conclusion
We believe these test results are promising and provide a good starting point for further experimental inquiries.
Notes
-
Experimental Validation of Autodesk® 3ds Max® Design 2009 and Daysim 3.0, Christoph Reinhart, 2009
-
https://goo.gl/maps/4krv99y11eD2 / last visit: 06.02.2018
Reference
-
Christoph Reinhart, Experimental Validation of Autodesk® 3ds Max® Design 2009 and Daysim 3.0, Autodesk Canada Co. Media & Entertainment, 2009
-
Hosek, Lukas and Wilkie, Alexander, An Analytic Model for Full Spectral Sky-Dome Radiance, ACM Transactions on Graphics - TOG, 2012